MARKET UPDATE SUMMARY
BRIERWOOD ESTATES in June had no single family homes that sold in June, holding at 12 sales for 2026. There are 8 Active homes for sale, one more than at the end of May. There were 2 more Pending homes added in June under contract for a total of 25 single family residential properties Sold, Active and Pending.
In 2025 a total of 18 homes sold in Brierwood so the community may surpass that number as the year has reached its halfway mark. 30 homes are the highest number of sold in one year in the past twelve years in Brierwood Estates.
More on the data as seen in the historical Brierwood chart further below:
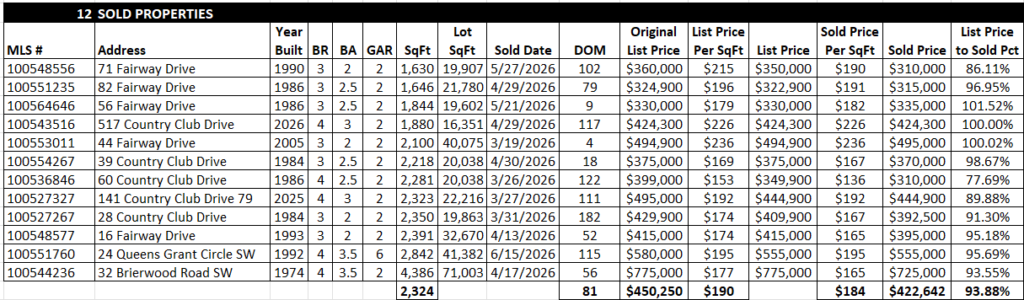
Sold homes: The average List Price Per Square Foot of Sold homes through June was $190 compared to the final $184 per sq. ft. Sold price, a difference of $6 per square foot from the List Price to the Sold Price. For 2026, the Price Per Square Foot for sold homes of $184 is down $8 from the $192 record average in 2025.
The average Days On Market (DOM) for Sold homes is 82, 23 days longer than those Sold in 2025. While the numbers reflect that buyers in the first half of the year were looking for homes at or over 2,100 sq. ft., that appears to be evening out.
The last indicator for Sold homes is the Original List Price to List Price of 90%, down 9% from the 99% of 2025.
It must be noted that the final Sold numbers may and do change. Sold homes will be added as a summary once they close in future monthly updates.
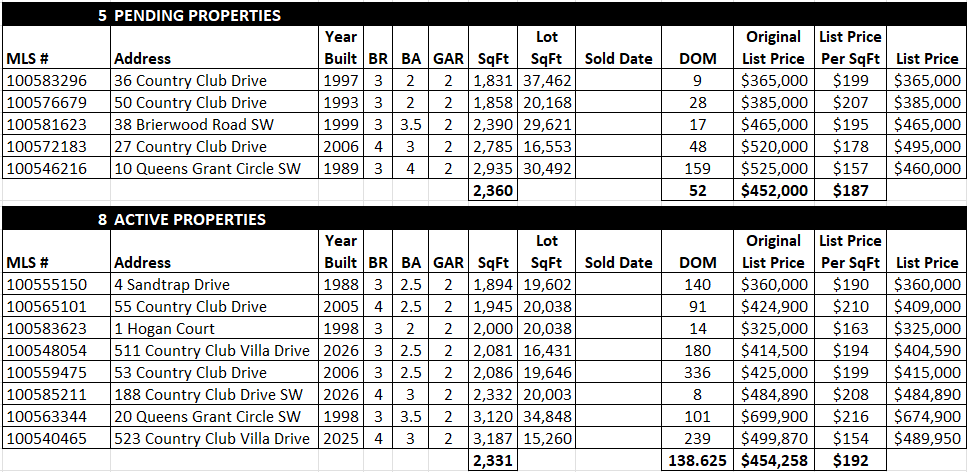 Pending homes: The average List Price Per Square Foot is $187, up $1 from the end of May.
The average Days On Market (DOM) for Pending homes is 52 days, a sudden reversal from the 97 days of the prior months of Pending homes of 2026. The current 52 Days On Market are 7 days shorter than the average of those in 2025.
Active homes: The average List Price Per Square Foot is $192, matching the $192 record average in 2025 and last month.
The average Days On Market (DOM) for Active homes is 138, 15 days longer than last month and 79 days longer than 2025.
Final Sold Price and Days On Market are indicators of a buyers or sellers market. With Sold Prices averaging lower and Days On Market are higher, the question becomes, “Is this truly a buyers market or is it only because of other factors?” A glance at the overall Coastal Carolina data (Coastal Carolina Market Data) shows the market remains strong compared to the year before. So the lower Sold Prices in Brierwood Estates may simply reflect the larger number of new developments surrounding Brierwood Estates and with it the new “bells and whistles” and amenities those communities provide.
What I believe “sells” Brierwood is its safe community, no HOA and wonderful residents that take pride in their properties.
The next several months will surely tell as data longevity begins to settle in over the short-term data fluctuations.
Summary: Heading into July, 2026 as mentioned, 12 homes have sold. This Brierwood Estates page will be updated monthly so that residents can see the current market happening with the community.
Meanwhile, it’s a proud time to be a Brierwood resident as we head into the heart of summer!